
See which team is slipping, before people start leaving
The mood and workload each person shares at every check-in with their manager, read by division, department and team, month after month. And which managers keep the rituals going, and which ones need support.

An average doesn’t tell you where to look
Between the annual survey and the HRIS, HR teams in multi-site groups are often flying blind.
The survey comes once a year
Results land weeks after the answers. Between two editions, nothing moves on the chart.
The average hides the team that is struggling
A good group score can cover up a division in difficulty. Without a breakdown, you don’t know which manager to call.
You find out through departures
The HRIS records resignations and sick leave, not what leads up to them. By the time the figure moves, it is late to help the team.
The pulse of your teams, without one more questionnaire
- 1HR
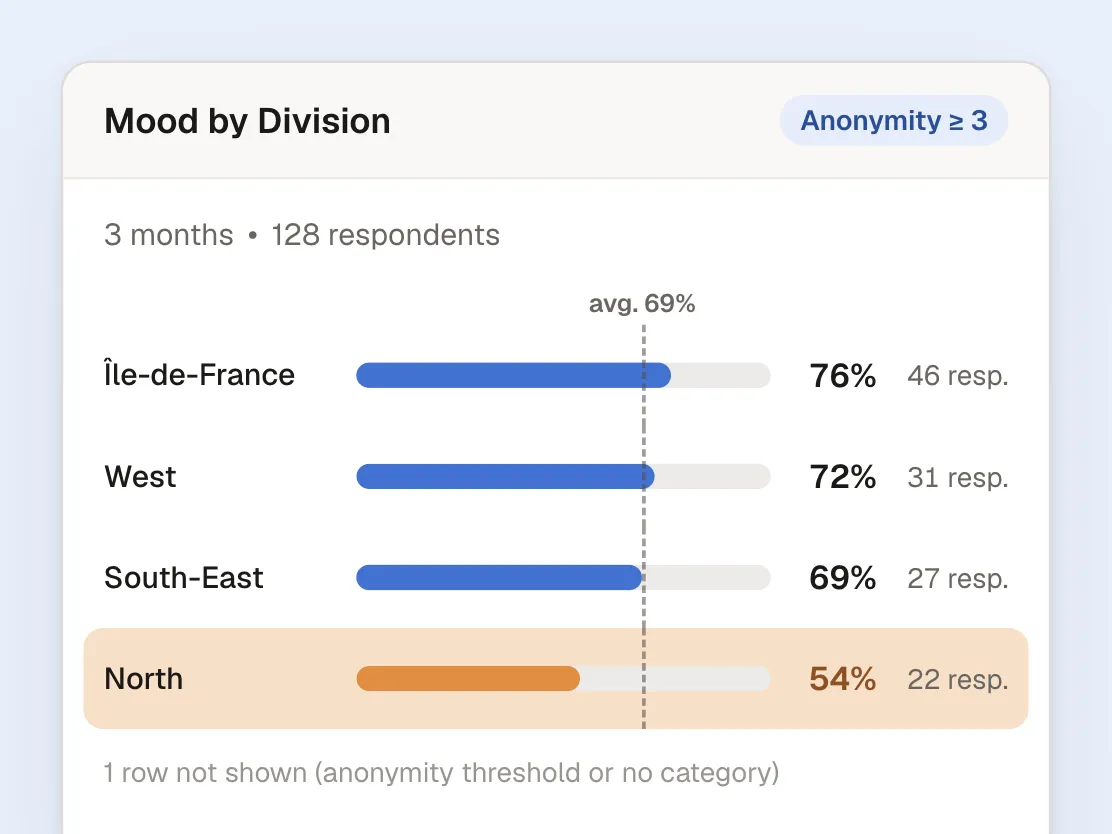
Read each division, not an average
Mood and workload come from the check-ins each person has with their manager. The dashboard ranks them by division, department, job title or team, and hides any group of fewer than 3 respondents.
- 2HR
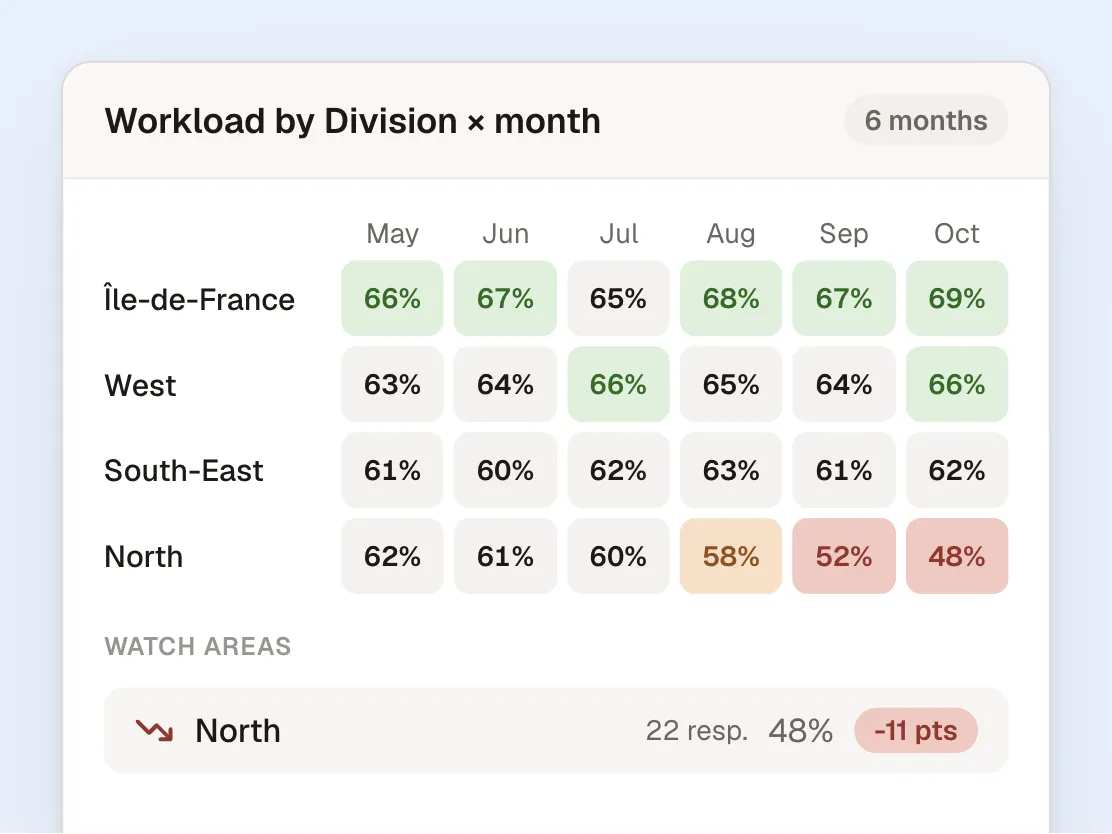
See what is slipping, month after month
Each segment, month by month, compared with the previous period or with last year. Watch areas surface the groups losing the most points, before the average moves.
- 3HR
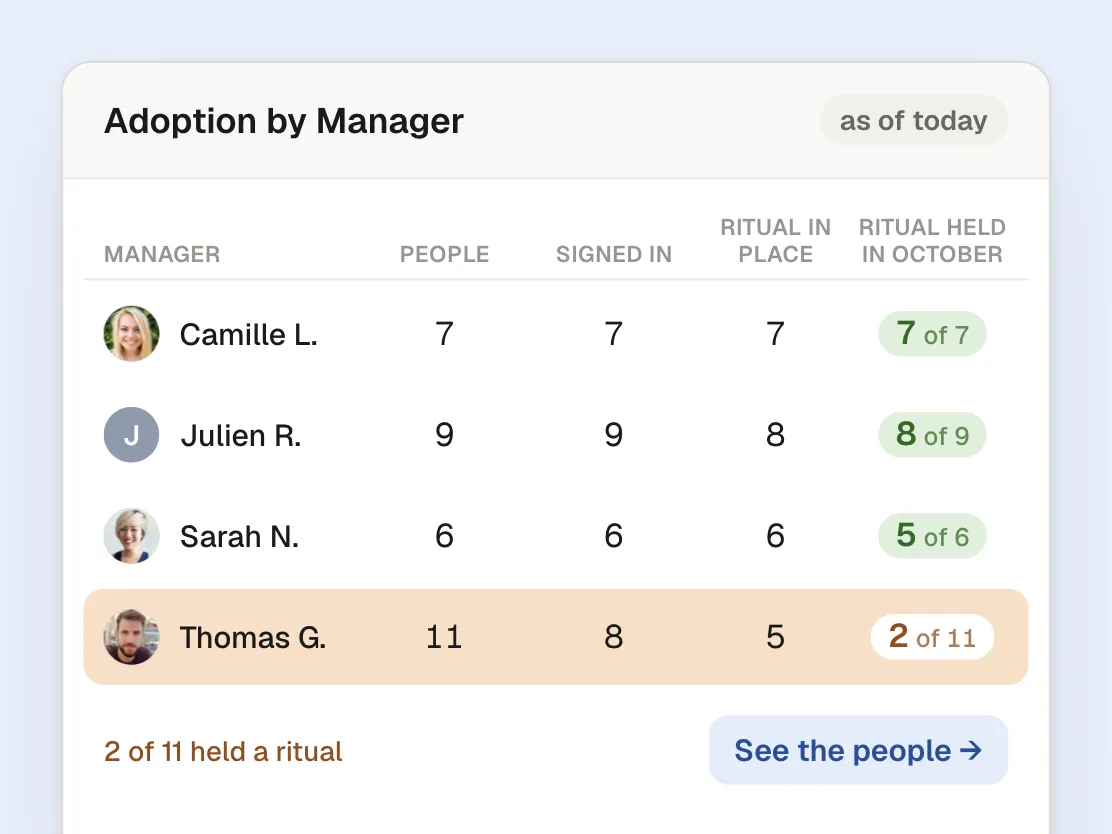
Know which managers keep the rituals going
By manager or by division: who has signed in, who has a ritual in place, who held it this month. The people who need support are listed, and an invitation can be resent in one click.
Everyone sees what concerns them
HR
The whole company’s dashboard: mood, workload and adoption by division, department or team, compared over time, exportable as PDF.
The manager of managers
In Trends, their scope team by team, month by month. 1:1s stay between each person and their direct manager.
The manager
Their team’s pulse, check-in after check-in, and the people to keep an eye on, while there is still time to act.
HR sees trends, not conversations
The dashboard never shows a group of fewer than 3 respondents: the cell stays hidden. What is said in a 1:1 stays between the person and their manager, and that is what makes the answers honest.
Frequently asked questions
Where do the figures come from?
From check-ins. At each meeting with their manager, the person describes their mood in a word or two and says whether their workload feels right. The dashboard counts the share of positive answers over the period.
How is anonymity preserved?
A group of fewer than 3 respondents is never shown: the cell is hidden, and the dashboard suggests widening the period or the scope. A mood word only appears once at least 3 people have chosen it.
Do we need to replace our HRIS?
No, Popwork complements it. The division, department or job title your organisation already knows are used to break down the results. Popwork brings what the HRIS cannot see: how teams are doing, check-in after check-in.
What if our organisation isn’t filled in yet?
Results are shown by team in the meantime. As soon as each person’s division or department is filled in, the dashboard breaks down automatically.
Can we compare two periods?
Yes: with the previous period or with last year, over 3, 6 or 12 months, or over a period you choose. The dashboard can be exported as PDF, methodology included, for an executive committee.
How do we know whether managers are playing along?
The Adoption tracker shows, manager by manager, who has signed in, who has a ritual in place and who has held it. The people who need support are listed: never signed in, no ritual, or a ritual never held.
Your teams make your company
Give everyone a simple, regular one-to-one with their manager, and finally see how every team is doing.
- Rated 4.8 out of 5 on Google
- Hosted in Europe, GDPR compliant
- Product of the Day on Product Hunt